
We got a little busy in February and didn’t write up an analysis of the San Antonio real estate market for January 2025, but we’re back this month to talk about February 2025 (statistics are released the month after they occur). If you’re a numbers junkie, you’ll love some of the insight this analysis provides. If you are more of a “just tell me what’s going on,” feel free to skim through and hit the highlights. Either way, you’re sure to find some interesting info about our local real estate market.
If you’ve followed along with any of our market reports recently (we’ve covered zip codes 78232, 78247, 78248, 78249, 78250, 78257, 78258, 78259, 78260, and 78261 recently), you’ll know that San Antonio has seen its ups and downs, but also has its bright spots and weaker markets areas.
Market Overview: Signs Of Stabilization After Recent Fluctuations
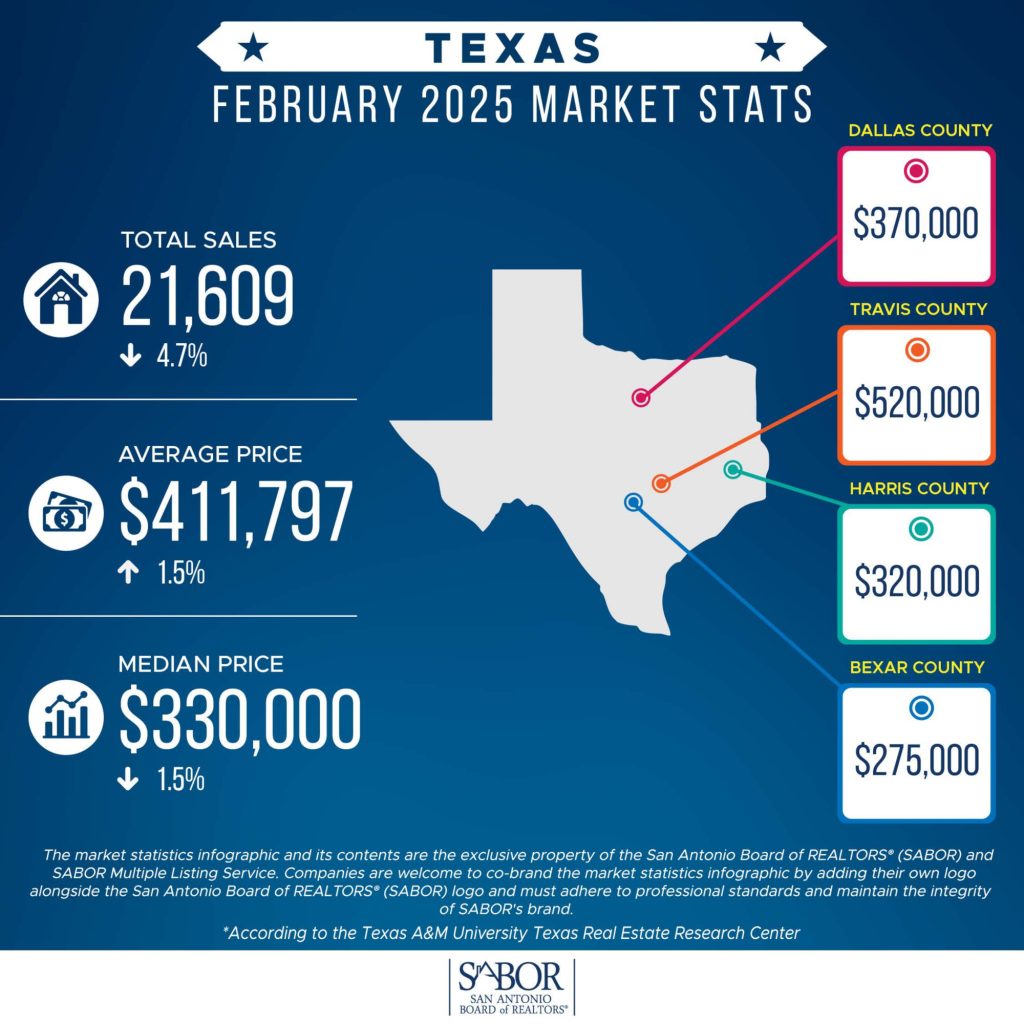
After years of volatility following the pandemic-era boom, the San Antonio real estate market is showing signs of a more balanced environment. According to the latest data from the San Antonio Board of REALTORS (SABOR) Multiple Listing Service for February 2025, we’re seeing several key indicators pointing toward market stabilization with some notable sector-specific trends.
Single-Family Homes: Modest Price Growth Amid Reduced Volume
Single-family homes, which remain the backbone of San Antonio’s housing market, present an interesting picture in February:
- Closed listings: 2,407 single-family homes closed in February, representing an 8% decrease from the same period last year
- Average price: $356,165 (up 2% year-over-year)
- Median price: $289,995 (down 2% year-over-year)
- Dollar volume: $857,288,899 (down 6% from last year)
The modest increase in average price alongside a slight decrease in median price suggests a market that’s finding equilibrium. Fewer transactions are occurring, but values remain relatively stable, indicating neither a buyer’s nor seller’s market but rather a balanced environment.

New Construction: Substantial Declines Point To Developer Caution
New home construction shows significant pullback:
- Closed listings: 969 new construction homes (down 15% year-over-year)
- Average price: $310,190 (down 7%)
- Median price: $263,245 (down 10%)
- Dollar volume: $300,574,267 (down 21%)
These numbers reflect developer caution in the face of economic uncertainties, higher construction costs, and possibly lingering effects of elevated interest rates through 2024. The substantial decline in dollar volume indicates builders may be focusing on more affordable housing options rather than luxury developments.
Commercial Real Estate: A Tale Of Diverging Trends
The commercial sector shows remarkable growth in certain metrics while contracting in others:
- Average price: $355,168 (up 106% year-over-year)
- Median price: $310,250 (up a staggering 4408%)
- Closed listings: 19 (down 14%)
- Dollar volume: $6,748,197 (up 78%)
The dramatic jump in median price deserves special attention. This isn’t likely a true 4408% value increase but rather suggests a few very high-value commercial properties sold in February 2025, skewing the statistics. The 78% increase in dollar volume despite fewer transactions supports this interpretation.
Land And Acreage: Strong Growth In Value
Residential lots and acreage showed robust growth in median prices:
- Median price: $119,000 (up 19% year-over-year)
- Closed listings: 226 (up 6%)
This growth in land values, contrary to the trend in built properties, may indicate investors and future homeowners securing land for later development, possibly waiting for construction costs to moderate.
Days On Market And Inventory Levels
Property is taking slightly longer to sell compared to last year:
- Single-family homes: 83 days on market (up 1% year-over-year)
- Condominiums: 109 days (up 60%)
- Residential rental: 76 days (up 21%)
Inventory levels are healthier than in recent years with:
- Active listings: 14,330 for single-family homes (up 20% year-over-year)
- New listings: 4,463 (up 10%)
- Pending listings: 2,475 (down 17%)
The increase in active listings coupled with fewer pending transactions suggests buyers have more options and can take more time with purchasing decisions – a significant change from the frenzied buying conditions of the early 2020s.
Price Per Square Foot Trends
Price per square foot metrics offer another perspective:
- Single-family homes: $171/sqft (down 1% year-over-year)
- Condominiums: $201/sqft (down 2%)
- Multifamily: $162/sqft (down 12%)
These slight decreases in price per square foot align with the market’s general trend toward moderation.
Market Segments To Watch
Multifamily Properties
The multifamily sector shows signs of stress:
- Closed listings: 21 (down 16% year-over-year)
- Average price: $424,505 (down 9%)
- Dollar volume: $8,914,612 (down 24%)
These declines may reflect a cooling in the rental investment market after several years of significant growth.
Rural Farms And Ranches
Rural properties also show decreasing metrics:
- Closed listings: 37 (down 16%)
- Average price: $883,990 (down 31%)
- Median price: $550,000 (down 10%)
However, the average price per square foot actually increased 37% to $941/sqft, suggesting that while fewer rural properties are selling, those that do are commanding premium prices per acre.
Regional Performance
While the SABOR report doesn’t break down performance by neighborhood, monthly and historical data suggest:
- Central and downtown areas: Maintaining value better than outlying areas
- Northern corridor developments: Showing resilience despite the overall slowdown
- Far west and southwest growth areas: Experiencing more significant price adjustments
Economic Factors At Play
Several economic factors are likely influencing these trends:
- Interest rate fluctuations
- Regional job growth
- Migration patterns to and from San Antonio
- Housing affordability challenges
- Construction cost inflation
What’s Ahead For San Antonio Real Estate?
Based on the data trends, we can make several informed predictions for the coming months:
1. Price Stabilization To Continue
The modest price changes suggest the market is finding equilibrium. We expect continued moderate price growth in line with inflation for the remainder of 2025, with potentially stronger appreciation in centrally located and premium neighborhoods.
2. New Construction Recovery
While new construction has declined significantly, the increase in land purchases indicates pent-up demand. As economic conditions stabilize, we may see a gradual recovery in new home construction, particularly in the more affordable segments of the market.
3. Commercial Sector Evolution
The dramatic increases in commercial real estate values, despite fewer transactions, suggest a transformation in this sector. Premium commercial properties remain in demand, while obsolete spaces may continue to struggle, potentially creating redevelopment opportunities.
4. Rental Market Adjustment
The decrease in multifamily transactions and prices could signal a rental market adjustment. However, with single-family rental properties maintaining stable metrics, we may be seeing a shift in investor preferences rather than a fundamental weakness in rental demand.
5. Return To Seasonal Patterns
After years of unusual market conditions, the data suggests San Antonio may be returning to more traditional seasonal real estate patterns, with spring and summer likely to show increased activity compared to winter months.
Conclusion: A Market In Balance
The February 2025 SABOR MLS data paints a picture of a San Antonio real estate market that has largely worked through the extremes of the past few years. Neither buyers nor sellers hold overwhelming advantage, creating opportunities for both groups depending on their specific circumstances and property types.
For potential buyers, the increased inventory and longer days on market provide more options and negotiating room. For sellers with well-maintained, appropriately priced properties, the stable values and continued demand, particularly in desirable areas, suggest good outcomes remain achievable.
As always, real estate remains local, and conditions can vary significantly by neighborhood, property type, and price point. Working with a knowledgeable real estate professional is the best way to navigate these nuanced market conditions.
This analysis is based on data from the San Antonio Board of REALTORS® MLS Summary Report for February 2025, produced by the Texas Real Estate Research Center at Texas A&M University.