
When buying or selling a home, it is always helpful to understand the correlation between various metrics in the housing market so that you can see why your Realtor is suggesting a specific list price. We encourage you to read, learn, and ask questions – the more informed you are about the market, the better. Today, we’ll dissect the real estate market in 78258.
The 78258 Zip Code
The 78258 zip code is mostly comprised the neighborhoods on the far north central side of San Antonio – Stone Oak, Sonterra, Rogers Ranch, and Greystone Country Estates with some small bits of the eastern side of US 281 also included. You can see the boundaries of the zip code by searching for “78258” on Google Maps.
Note: These statistics are based off of data from the San Antonio Board of Realtors and Realtors Property Resource. They were pulled on August 6, 2024.
How’s The Real Estate Market 78258?
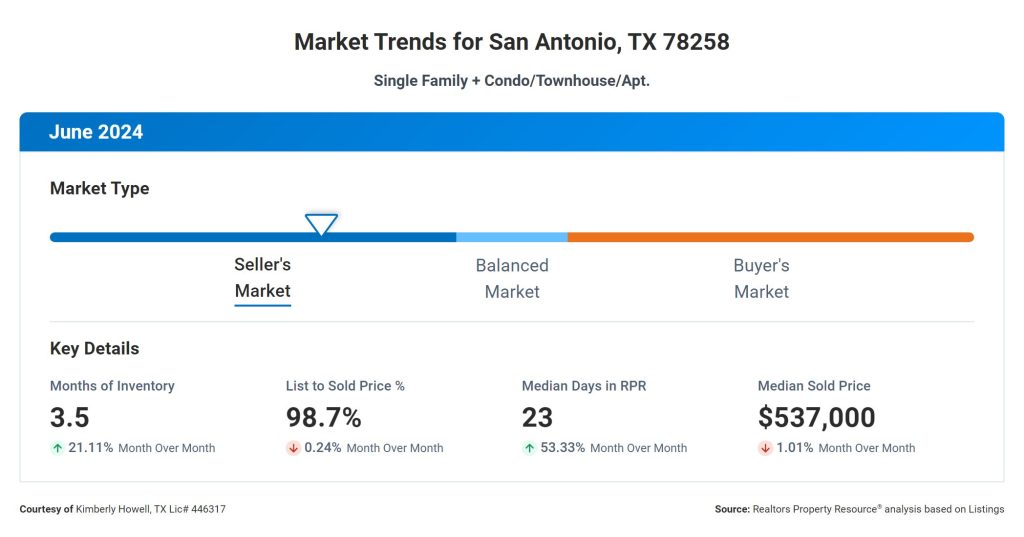
First, let’s look at the Months Supply of Inventory, which currently stands at 3.5 months. This metric indicates the number of months it would take to sell all the current inventory of homes on the market if no new listings were added. A lower months supply of inventory typically signifies a seller’s market, where there is high demand for homes compared to the supply available.
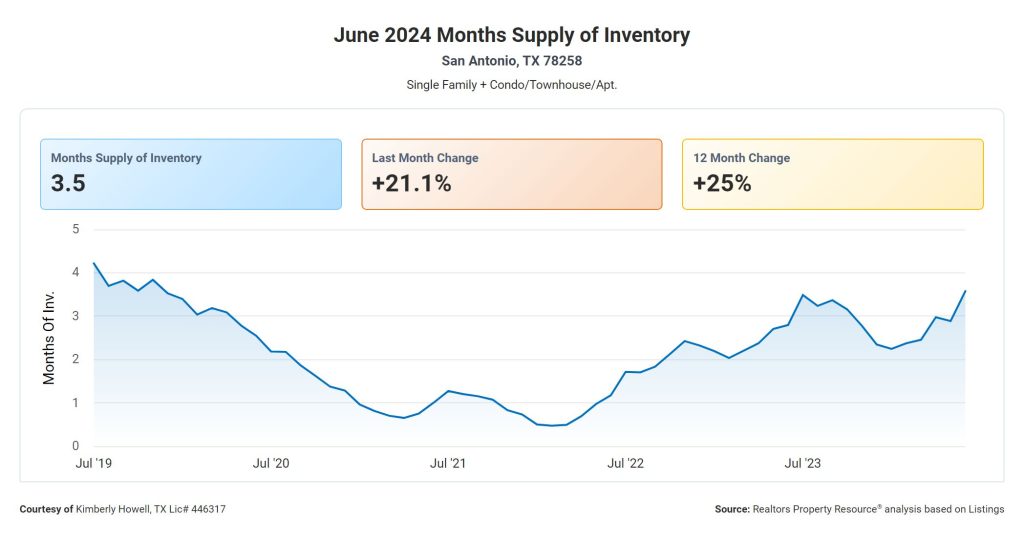
The 12-Month Change in Months of Inventory has increased by 25%, indicating a shift towards a more balanced market. This change suggests that there may be a slight increase in the number of homes available for sale compared to the demand from buyers.
Compare this to our recent analysis of the real estate market in 78260 and you’ll see that the 78260 zip code is much closer to a balanced market with 4.65 months of inventory.
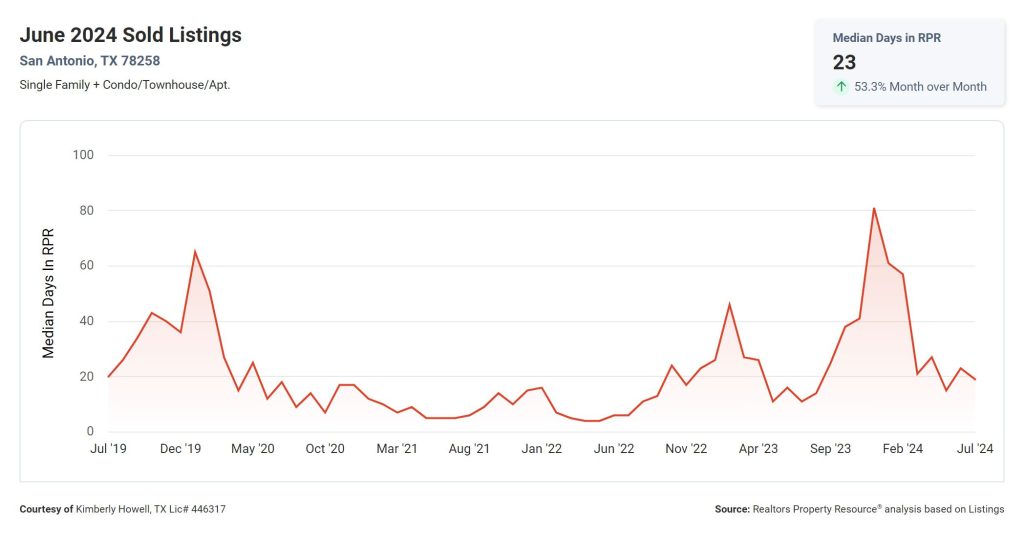
The Median Days Homes are On the Market is 23 days, which is relatively low and shows that homes are selling quickly in this market. This could be due to high demand, competitive pricing, or desirable location.
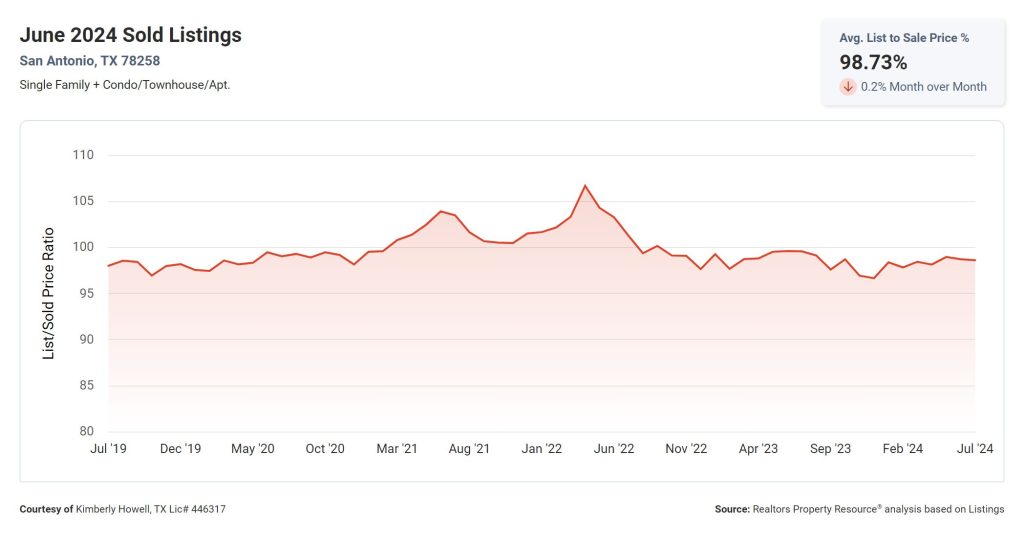
The List to Sold Price Percentage is 98.7%, indicating that homes are typically selling very close to their listing price. This can be a positive sign for sellers as it shows that buyers are willing to pay close to the asking price for properties in this market.
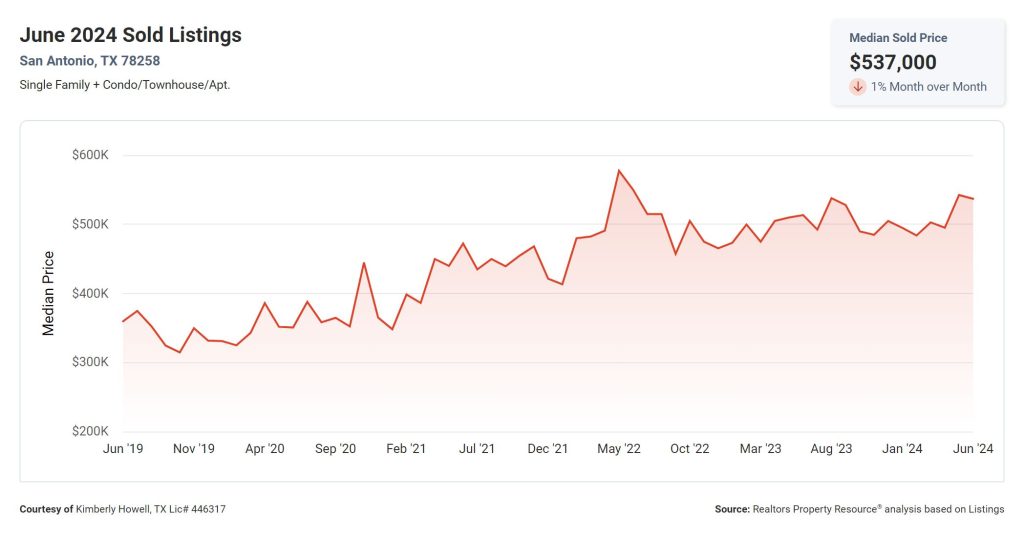
Finally, the Median Sold Price is $537,000, providing an overview of the average selling price in the market. This can be useful for both buyers and sellers to understand the current pricing trends and make informed decisions.
Get More Real Estate Market 78258 Info
What Does It All Mean
Overall, these metrics suggest a market that is relatively balanced, with homes selling quickly and close to their listing price. Buyers may need to act fast in this market, while sellers can expect to receive strong offers for their properties. It is important to stay informed about these trends to make informed decisions in the real estate market.
As always, we like to remind you that there is a lot that goes into pricing a home. It’s not just charts and graphs and a bit of fancy math. The best way to find out what your home is worth is to talk to an agent. They can look at the current market and factor in details about your home and others in your area that no computer can easily do. If you’d like to get the ball rolling, try our home valuation form.
Homes For Sale In 78258
These homes for sale in San Antonio 78258 are the most recent homes on the market. To search homes for sale, you can use our full-featured home search or connect with an agent that can show you any of these homes or help you refine your search to find exactly what you’re looking for.