
Today, we’ll be talking about the real estate market in zip code 78261. In case you missed it, we’ve already covered 78232, 78249, 78250, 78257, 78258, 78259, and 78260 – and we have plans to cover many more. If you don’t see your favorite listed, please feel free to reach out to us and ask us to hurry up and get to your zip code.
Each time we do one of these real estate market reports, we like to remind you that numbers aren’t everything (our engineer friends would disagree). There are things about a home that a look at the numbers can’t reveal. That’s why many agents will ask to set an appointment with you to view your home when you ask them what your home is worth.
We need to look at the home and do some research in order to truly price a home for sale. All of these numbers help guide us to the eventual list price, but there is definitely a bit of art to this science.
The 78261 Zip Code
The 78261 zip code sites to the north of Evans Road and east of US 281. It has a bit of an amoeba-esque shape, so it is hard to define its boundaries, but in the SABOR MLS, it occupies both MLS area 1802 and 1804 (1800, the parent MLS area of these two consists mostly of the large swatch of land centered around US 281 that extends northward from Loop 1604).
The zip code’s average population density is lower than average, but this can be quickly explained when taking a look at Google Maps (satellite view) – there is still a lot of undeveloped land in this area. Most of the homes in this area were built in the 2000s.
Popular neighborhoods in 78261 include Bulverde Village and Wortham Oaks.
How’s The Real Estate Market 78261?
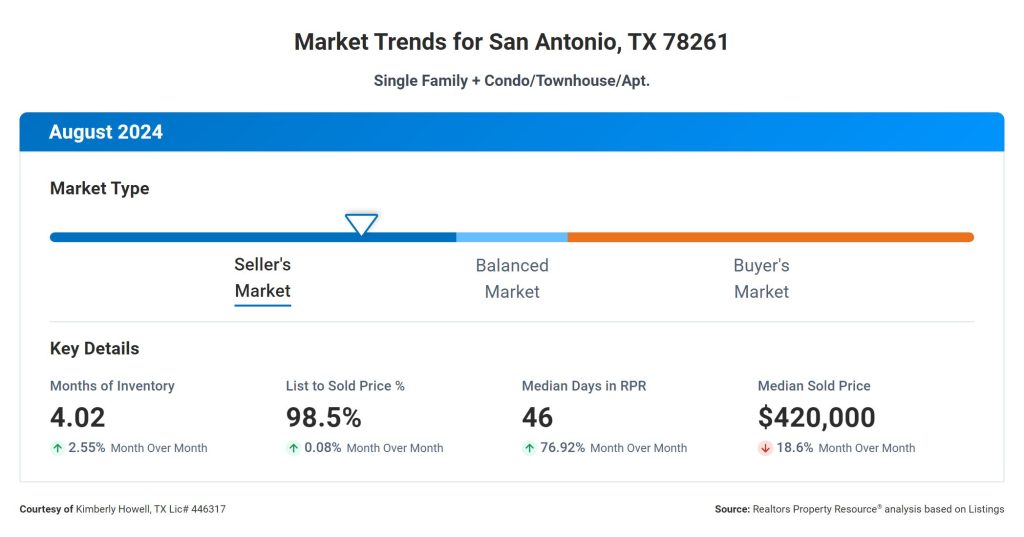
The Months Supply of Inventory at 4.02 indicates the number of months it would take to sell all the current listings in the market based on the current sales pace. A lower number typically indicates a seller’s market, where demand exceeds supply, leading to potentially higher prices.
Although 4.02 Months Supply of Inventory is a little lower than we’d like to see for a balanced market, we don’t feel it’s enough to truly be shifting into a seller’s market yet. Time will tell.
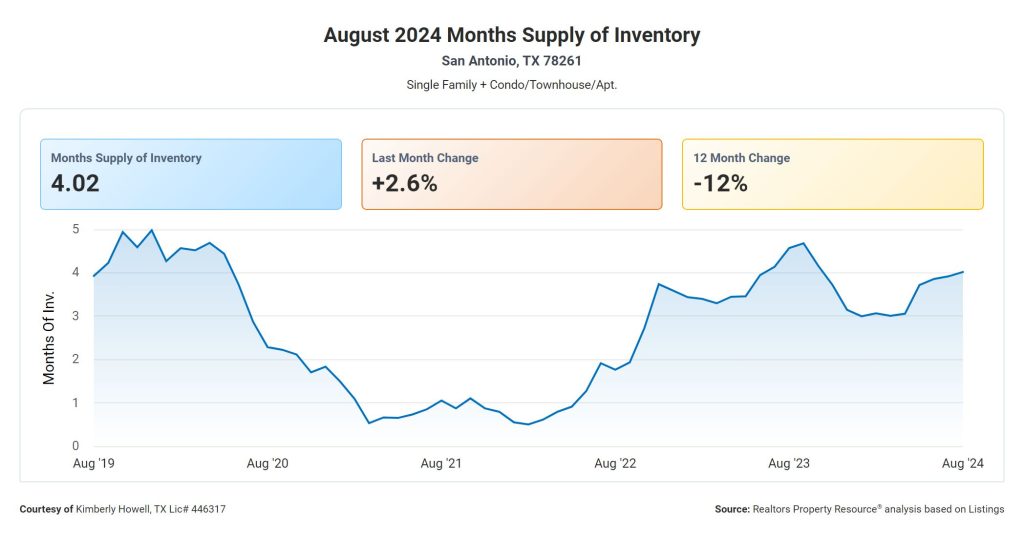
The 12 Month Change in Months of Inventory at -12.04% suggests a decrease in the amount of time it would take to sell all the listings compared to the previous year. This could signify a tightening of the market and potentially more competition among buyers, which could potentially drive prices up.
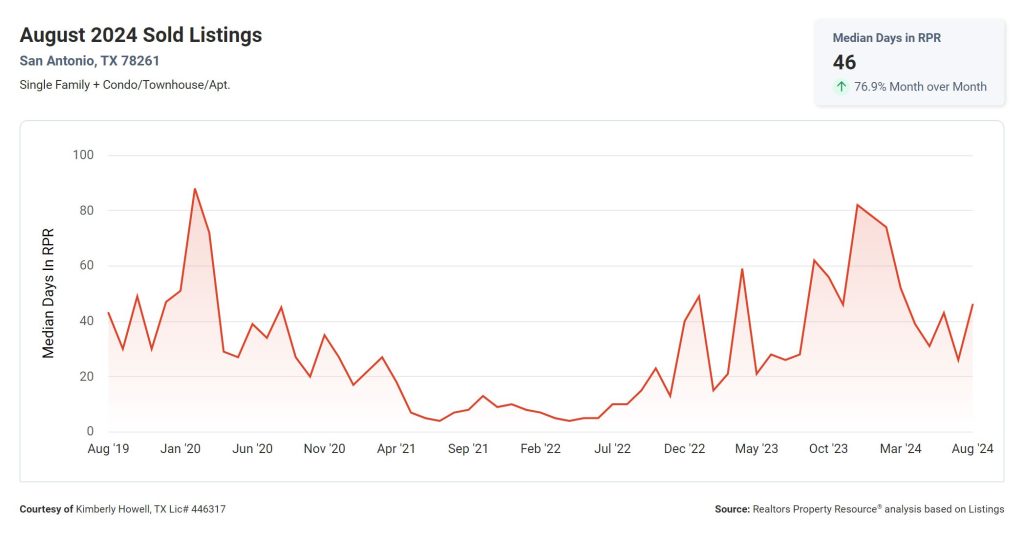
The Median Days Homes are On the Market at 46 days gives an idea of how quickly homes are selling in the current market. A lower number typically indicates a faster-paced market, while a higher number may suggest a slower market. At 46 days, things are moving at a decent pace in this area.
The List to Sold Price Percentage at 98.5% shows the average percentage of the original listing price that homes are selling for. A higher percentage indicates that homes are selling close to their listing price, which could mean that sellers are pricing their homes competitively.

Lastly, the Median Sold Price at $420,000 is the midpoint of all the sold prices in the market. This can give buyers and sellers an idea of the overall price range of homes in the market. You’ll notice on the chart below that despite ups and downs, the overall trend for home prices is still upward over the years.
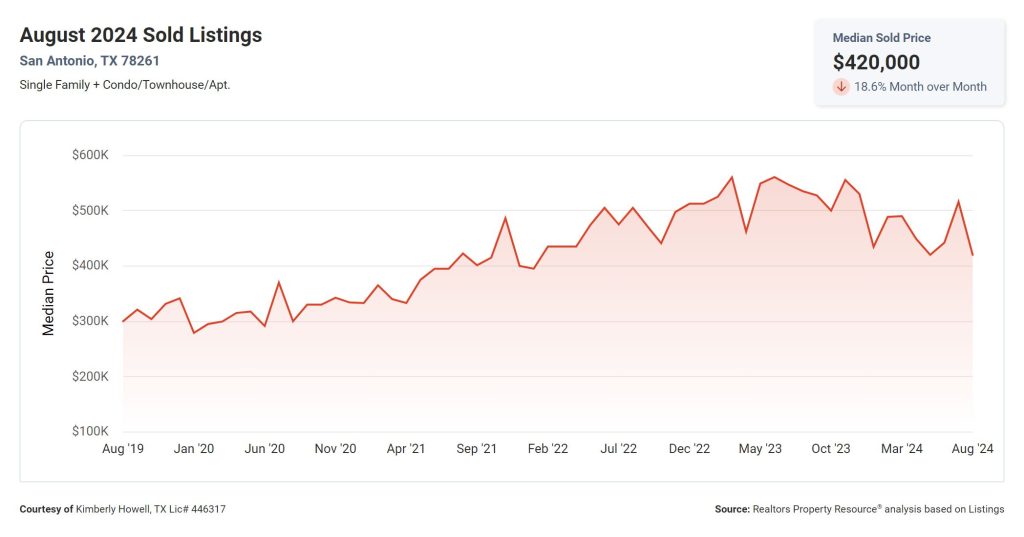
We just read an interesting statistic from the San Antonio Business Journal the other day – between 2000 and 2024, home values rose 161% in San Antonio. Good for homeowners looking to bank on their equity long term, but not so good news for the state of affordable housing in our city.
Get More Real Estate Market 78261 Info
What Does It All Mean
Overall, these metrics suggest that the current real estate market is relatively strong, with low inventory levels, a faster pace of sales, and homes selling close to their listing prices. Buyers may need to act quickly and be prepared to make competitive offers, while sellers may have the opportunity to command higher prices for their properties.
Price reductions have been common throughout the San Antonio area however, so some of the data may be skewed by looking at list price to sales price ratios (as they are based on the last list price the home was at).
Homes for Sale in 78261
If you want to take a look at some homes for sale in 78261, this is the place to be. Our list is updated regularly, so please bookmark this page and come back often to see what new homes have been listed for sale. If you see something you’d like to set up a showing on, just let us know and we’d be happy to get things going.
You can also click the “Schedule Showing” button on any property’s detail page and with a bit of information, we’ll set it up and go show you the home.