
The San Antonio real estate market continues to evolve in 2025, showing signs of becoming a buyer’s market after years of favoring sellers. Based on data from the San Antonio Board of Realtors MLS for March 2025, we’re seeing several notable trends that impact both buyers and sellers in the current market. Let’s dive into the numbers to understand where the market stands and where it might be heading.
You can check out last month’s stats and analysis in our post San Antonio Real Estate Market Trends (February 2025).
Market Overview: Key Indicators
The San Antonio housing market in March 2025 presents a mixed picture with some interesting developments:
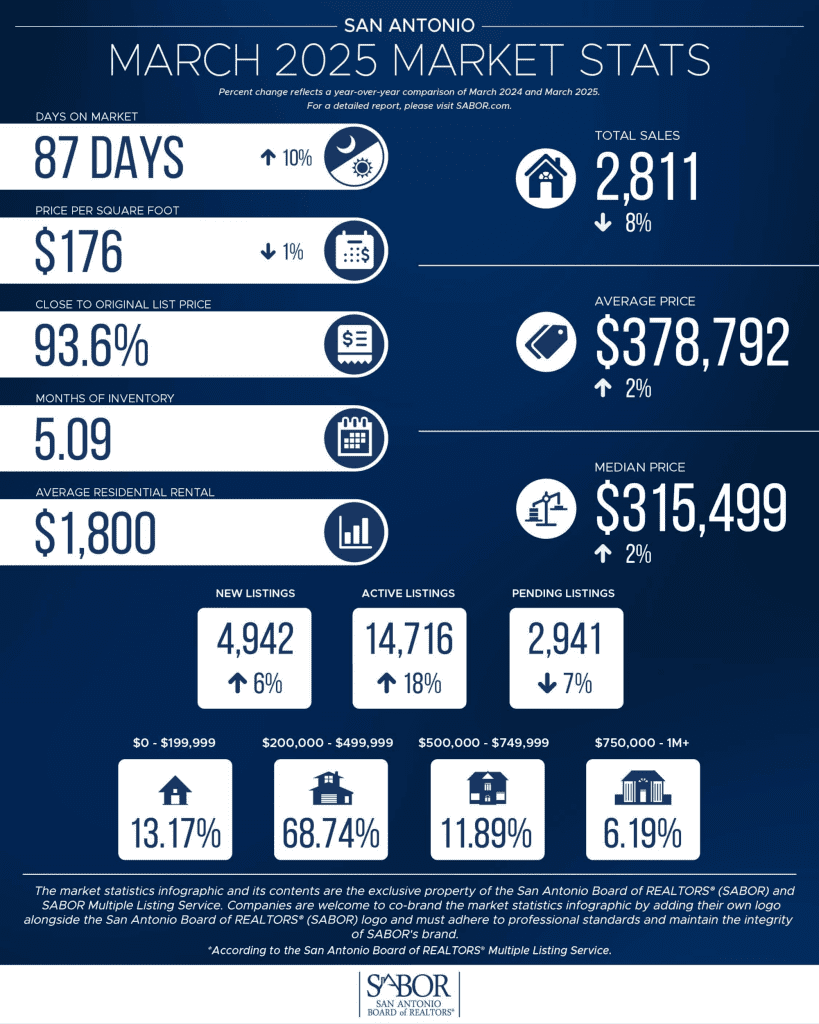
- Closed Sales: 2,811 single-family homes sold in March 2025, down 8.2% compared to March 2024
- Median Price: $315,499, up 1.8% year-over-year
- Average Price: $378,792, up 1.9% year-over-year
- Months of Inventory: 2.9 months, slightly down from 3.2 months a year ago
- Days on Market: 87 days, up 8 days from March 2024
- Active Listings: 14,716, up 18% from last year
- New Listings: 4,942, up 6% year-over-year
These numbers reveal a market that is showing signs of cooling transaction volume while maintaining modest price growth—a shift from the more volatile conditions we’ve seen in recent years.
Price Trends
The median home price in San Antonio has stabilized around the $315,000 mark, representing modest 1.8% growth year-over-year. This moderate appreciation suggests a healthier, more sustainable growth pattern compared to the rapid price increases seen in previous years.

Looking at the 3-month moving average for median prices, we can observe a stabilization trend:
- January 2025: $303,496
- February 2025: $299,328
- March 2025: $299,331
The average price of $378,792 indicates that higher-priced homes continue to influence the market, with the gap between average and median prices suggesting ongoing activity in premium segments.
Market Segments: Who’s Buying What
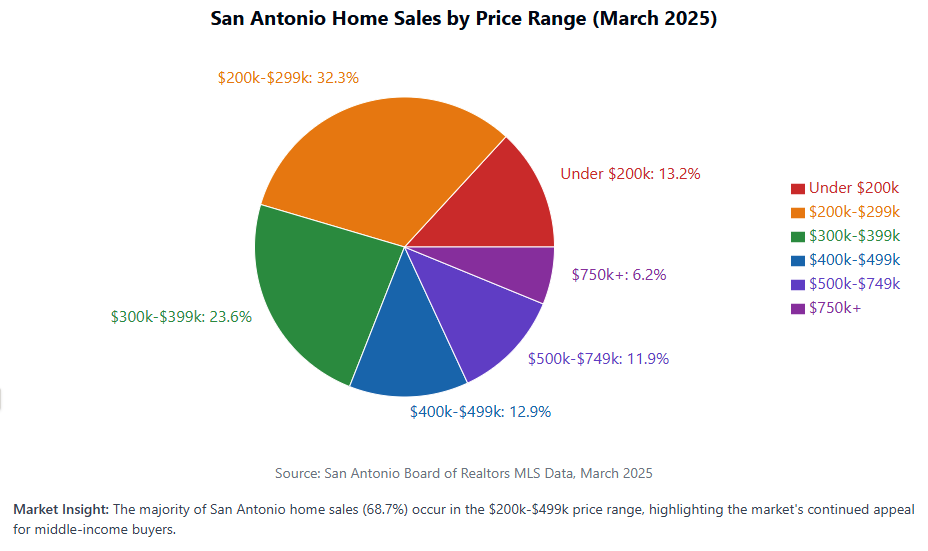
The price distribution of homes sold in March 2025 reveals interesting insights into market activity:
- Entry-level market (under $250k): 51.6% of sales
- Mid-market ($250k-$499k): 53.2% of sales
- Luxury market ($500k+): 18.1% of sales
The most active price segment remains $300,000-$399,999, accounting for 23.6% of all sales. This concentration highlights San Antonio’s continued appeal for middle-income homebuyers.
Market Velocity and Inventory
The market is showing signs of slowing transaction speeds while inventory levels remain constrained:
- Days on Market: The average time to sell increased to 87 days, up 8 days from last year
- Months of Inventory: At 2.9 months, the market still favors sellers (balanced market = 6 months)
- Active Listings: The 18% increase in active listings suggests improving options for buyers

The absorption rate (homes sold divided by active listings) stands at 0.19, indicating that about 19% of the available inventory sold in March. The new listings to sold listings ratio of 1.76 shows more homes entering the market than leaving it—a positive sign for inventory growth.
New Construction vs. Existing Homes
The market dynamics differ significantly between newly built and existing homes:
- New Construction: 1,055 sales (37.5% market share), down 14% year-over-year
- Existing Homes: 1,756 sales (62.5% market share), down 4% year-over-year
- Price Differential: New homes averaged $355,365 vs. $392,869 for existing homes
The larger decline in new construction sales may reflect ongoing challenges in the homebuilding sector, including higher construction costs and financing hurdles for developers.
Property Type Performance
While single-family homes dominate the market, other segments show varying performance:
- Condos/Townhomes: 45 sales (-10% YoY), median price $217,000 (+25% YoY)
- Multifamily: 26 sales (-35% YoY), median price $382,000 (+13% YoY)
- Residential Lots: 205 sales (-13% YoY), median price $120,000 (-1% YoY)
- Residential Rental: 1,566 transactions (+12% YoY), median rent $1,700 (-3% YoY)
The significant price increase in condos and townhomes despite fewer sales suggests growing demand for lower-maintenance living options, potentially driven by demographics including both downsizing empty-nesters and first-time homebuyers seeking affordability.
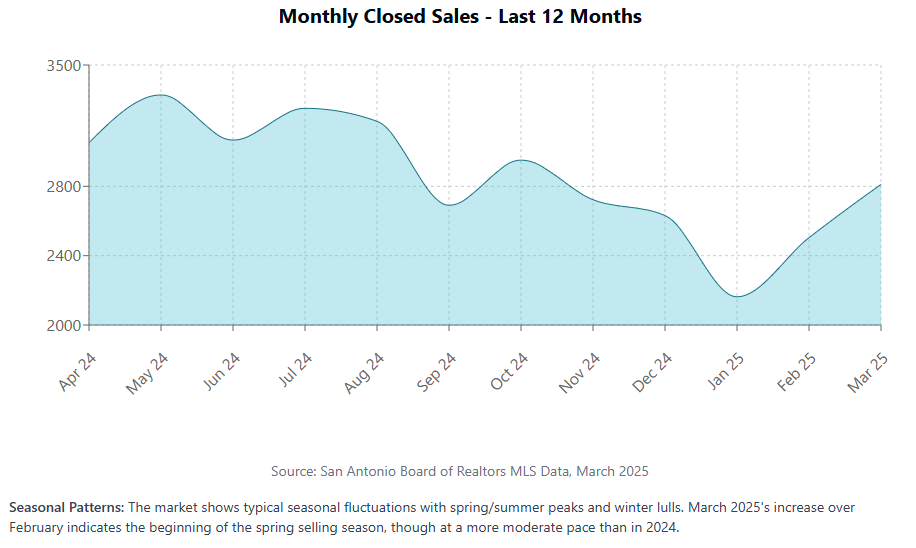
Seasonal Patterns
The February to March transition typically shows increased activity as spring approaches. This year’s 12.3% increase in closed sales from February to March is notably lower than the 17.5% increase observed during the same period in 2024, suggesting a more subdued seasonal uptick.
Recent News and Broader Context
When considering the San Antonio housing market, it’s important to place local trends within both regional and national contexts:
Local Market Shift
San Antonio has officially shifted to a “buyers market,” with homes staying on the market longer and prices trending lower than in previous periods. This represents a significant change from early 2024, when the market still favored sellers. The increased inventory of homes for sale is giving buyers more options and negotiating power.
Population Growth Continues
San Antonio gained more residents than any other U.S. city in 2023 according to the U.S. Census Bureau. Despite recent cooling in the housing market, this population growth continues to provide underlying support for housing demand in the region.
Supply and Demand Dynamics
Recent reports suggest that San Antonio has experienced a surge of new home construction where supply is outpacing demand right now. This oversupply situation may continue to put downward pressure on prices through 2025.
National Housing Context
Nationally, mortgage rates are expected to stay elevated between 6.5% and 7% throughout 2025, which impacts affordability across all markets. However, the National Association of Realtors predicts existing-home sales will be up 7 to 12 percent in 2025 nationwide as buyers adjust to the new normal of higher rates.

Market Forecast: What’s Next for San Antonio?
Based on our analysis of SABOR data and recent market news, here’s what we might expect for the San Antonio real estate market in the coming months:
- Moderate Price Growth: Expect continued modest appreciation in the 1-3% range annually, far below the double-digit growth seen in previous years but maintaining positive momentum.
- Inventory Advantage for Buyers: The surge in active listings (up 18% year-over-year) should continue, giving buyers more choices and negotiating power throughout 2025.
- Extended Marketing Times: The trend of increasing days on market (now at 87 days, up from 79 a year ago) is likely to continue, requiring sellers to set realistic pricing and expectations.
- Rate-Sensitive Market: With mortgage rates projected to remain elevated but gradually decline throughout 2025, we may see incremental improvements in affordability and buyer activity.
- Neighborhood Divergence: Expect increasing variation in performance between neighborhoods, with desirable areas maintaining stronger price growth and faster sales than peripheral locations.
The San Antonio market appears to be transitioning to a more balanced environment that provides moderate price growth with improving conditions for buyers. This represents a normalization after years of extreme seller advantage.
For buyers, the increased inventory and longer marketing times create more negotiating room than we’ve seen in recent years. For sellers, proper pricing and preparation are essential as the days of automatic multiple offers are behind us in most price segments.
This analysis is based on data from the San Antonio Board of Realtors MLS for March 2025 and recent market reports. Market conditions can change rapidly; consult with a real estate professional for the most current information specific to your situation.